In my research for my last post, I turned up an interesting study by the NIH that contained a graph projecting lifetime medical expenditures.
Here's the graph:
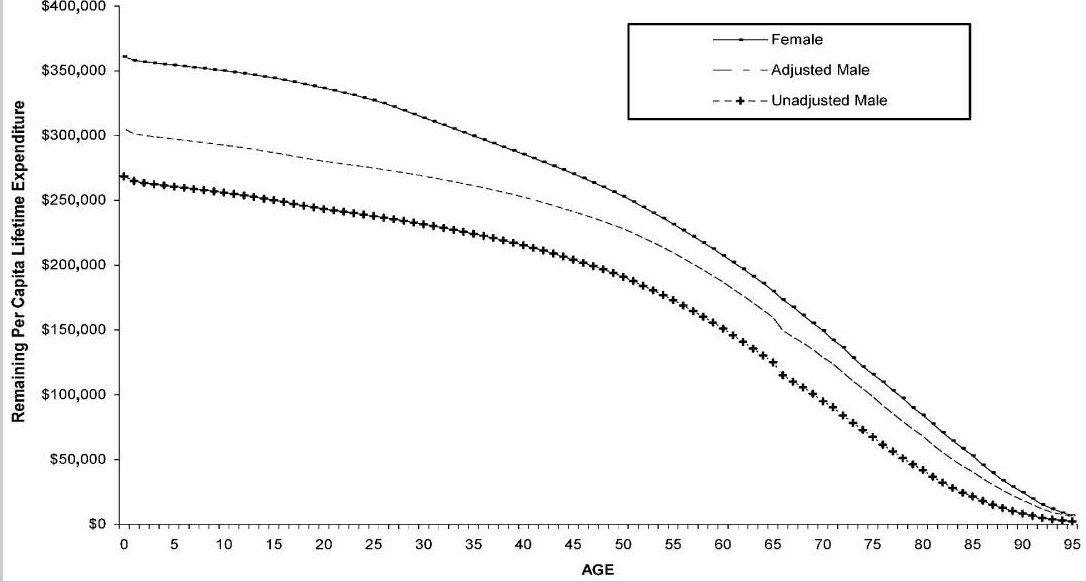
I wondered how well the graph holds up over time and against our population as a whole.
First, a few details:
- The scale is in the dollars of 2000 (cost of living is up 40% since then). I missed this in my last post so I had to recalculate a bunch of stuff.
- The pre-retirement data was taken in Michigan (5.6% lower cost of living than average).
- The post-retirement data comes from Medicare (average).
- Life expectancy is 80, not 95.
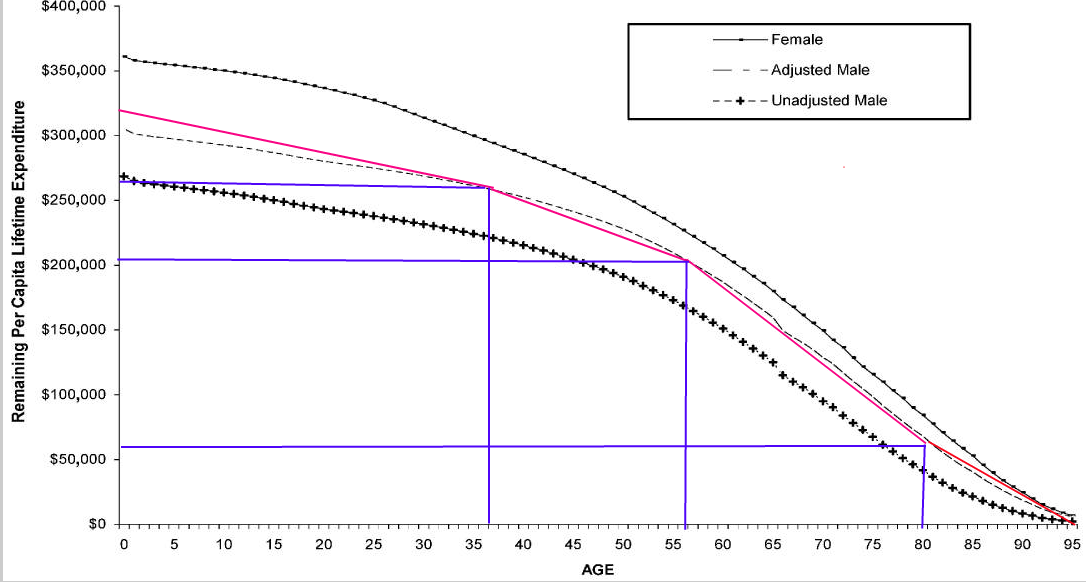
The average of male/female starts at $316,000 and there are four slope segments as shown below.
- The first (red) segment goes from birth to age 37 and has a slope of $51,000/37 years ($1,378/yr).
- The second segment goes from age 37 to age 56 and has a slope of $58,000/19 years ($3,053/yr).
- The third segment goes from age 56 to age 80 and has a slope of $145,000/24 years ($6,042/yr).
- The fourth segment goes from age 80 to age 95 and has a slope of $60,000/15 years ($4,000/yr).
The fourth segment is counter-intuitive so I'll use $6,042/yr for that one too.
The population in 2000 was 281,421,906.

Based on the graph below, we spent $1.4 trillion in 2000 but the NIH curve predicts only $971 billion (after adjusting for the cost of living in Michigan). The Centers for Medicare & Medicaid Services (CMS) reports $1.4 trillion too. What's wrong?

The difference is the gross profits taken by insurance companies since the NIH report used "data on the source of payment, by age and sex, to the aggregate figures to estimate the per capita amount paid by Medicare and private insurance".
The profit, then, is 100-(971/1400 x 100%) = 30.64%; small as gross margins go. This is the same number I calculated in an earlier post.
I no longer advocate against profiting from health care insurance or delivery but it's still there; those profits fuel retirement accounts. We'll also see that single-payer (socialized) systems are no more cost-effective.
I no longer advocate against profiting from health care insurance or delivery but it's still there; those profits fuel retirement accounts. We'll also see that single-payer (socialized) systems are no more cost-effective.

Using the increased population and the 40% cost of living increase since 2000 (and the cost of living in Michigan), I get $1.721 trillion out of an actual cost of $2.9 trillion; I should have gotten $2.03 trillion assuming constant profits.
Oh, but wait!
Health costs (like all other government-subsidized industries, especially education since it has been a government near-monopoly forever) have outpaced inflation by a wide margin ever since 1965; thanks LBJ!

Using a more recent curve (below, with a common index in 1982), health costs are up 68% since 2000. I get 68% by extending the blue curve below to 2013 with the same slope (to 430) and dividing by the value 255 in 2000 (430/255=1.68).
By the same analysis, the ratio of medical costs to CPI in 2013 was 430/230 = 1.87. Keep this number in mind.
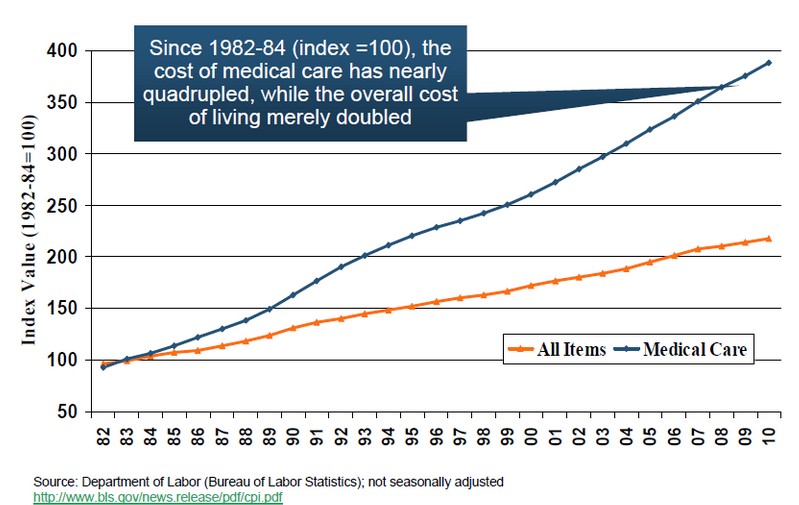
Health costs (like all other government-subsidized industries, especially education since it has been a government near-monopoly forever) have outpaced inflation by a wide margin ever since 1965; thanks LBJ!
By the same analysis, the ratio of medical costs to CPI in 2013 was 430/230 = 1.87. Keep this number in mind.
Adjusting by 68% instead of 40%, I get;

This gives me $2.06 trillion; a very good correlation to $2.03 trillion.
I also get pretty good correlation to Medicare spending at $470 billion versus $495 billion actual; Medicare direct overhead is about $5 billion and Medicare Part C providers make a profit that, again, is not accounted for in the NIH report.
To summarize;
Population rose 12.5% since 2000 but medical costs rose 107%.
The number enrolled in Medicare increased 25% (Boomers) but spending rose 87%.
To summarize;
Population rose 12.5% since 2000 but medical costs rose 107%.
The number enrolled in Medicare increased 25% (Boomers) but spending rose 87%.
Whiskey Tango Foxtrot!
The good news is that the graph is pretty damned accurate.
The bad news is that the average lifetime cost is $729,000 in 2013 dollars;
($316,000 x 1.056 (Michigan) x 1.68 (Medical COLA) x 1.3 (Profit)) = $728,792
This is an absurd yet true result. Absurd because it represents 47% of the median ($42,000/yr) wage earner's pre-tax lifetime earnings of $1,553,500;
((15,080+42,000/2) x 25) + (42,000 X 20) = $1,553,500
.png)
Poverty and rational thought aside, $728,792 in lifetime medical costs is not currently affordable for anyone outside the 10th percentile. They are still way too high for minimum wage earners and this is leaving us with Medicaid; not good.
This is what my friend and golfing buddy Denny would call a Disgusting Frasier.
How Do We Compare Worldwide
With adjustment for time, Michigan's cost of living index and profit, the segment costs are:
Comparing costs worldwide we see this;

This doesn't tell the whole story though; we have to compare costs to per-capita GDP.
| Per-Capita GDP | Per-Capita Health Cost | Health Cost Percentage | |
| Italy | $30,136.00 | $3,012.00 | 9.99% |
| Japan | $36,266.00 | $3,213.00 | 8.86% |
| UK | $36,941.00 | $3,405.00 | 9.22% |
| Australia | $42,640.00 | $3,800.00 | 8.91% |
| Sweden | $41,191.00 | $3,925.00 | 9.53% |
| France | $35,548.00 | $4,118.00 | 11.58% |
| Germany | $39,028.00 | $4,495.00 | 11.52% |
| Canada | $42,734.00 | $4,522.00 | 10.58% |
| Switzerland | $45,418.00 | $5,643.00 | 12.42% |
| US | $54,609.00 | $8,508.00 | 15.58% |
The most efficient of these (Japan) would cost 8.86/15.58 = 56.8% of $728,792 or $414,447 over a lifetime; 27% of a median wage earner's lifetime income; a workable amount.
However, the 8-9% of GDP costs are just what we'd pay if medical costs tracked the general cost of living (15.8%/1.87 = 8.33%), effectively putting the lie to the purported advantage of single-payer systems.
This is not a matter of demand outstripping supply; the supply of doctors has outpaced population growth for decades as shown below.
 The problem is prices.

I had thought that the Department of Health and Human Services, our regulator in this area, was watching this but clearly (and unsurprisingly) it is not doing it's job. It does better on Medicare costs but the overall performance is generally miserable.
We may be shocked at the $60 billion price tag for cleaning up after Hurricane Sandy. We spent almost that much last week on health care. We spend more every year on artificial knees and hips than what Hollywood collects at the box office. We spend two or three times that much on durable medical devices like canes and wheelchairs, in part because a heavily lobbied Congress forces Medicare to pay 25% to 75% more for this equipment than it would cost at Walmart.
This is another indication that government is too big; it sucks at virtually everything it tries to do. Better to have four well run departments (Justice, State, Defense & Treasury) than 21 crappy ones.
How Do We Fix This?
In a well researched report, I learned that Japan regulates prices very aggressively so that spending there has increased by only 2 GDP percentage points in three decades as compared to 8 points in the US.
Ordinarily I'd oppose government price regulation in a free market but this is not a free market; government directly pays for more than 1/3 of all US health care (55 million in Medicare and 62 million in Medicaid) and subsidizes millions more with Obamacare. I was even able to convince my old pal Leo that this would not be an attack on free-market capitalism; an argument not easily won.
We have to cut prices nearly in half (1.87) to realign them with the ordinary cost of living by the time 20 years has gone by (reduce costs by 3.1%/yr for 20 years).
In a trend similar to what we’ve seen in colleges and universities — where there has been an arms race of sorts to use rising tuition to construct buildings and add courses of study — the hospitals improve and expand facilities (despite the fact that the U.S. has more hospital beds than it can fill), buy more equipment, hire more people, offer more services, buy rival hospitals and then raise executive salaries because their operations have gotten so much larger. They keep the upward spiral going by marketing for more patients, raising prices and pushing harder to collect bill payments. Only with health care, the upward spiral is easier to sustain. Health care is seen as even more of a necessity than higher education. And unlike in higher education, in health care there is little price transparency — and far less competition in any given locale even if there were transparency. Besides, a hospital is typically one of the community’s larger employers if not the largest, so few complain...except the likes of me.
Education has to behave reasonably right away; this farce has continued far too long.
 The cost of living goes flat on day 1 because we stop borrowing and the value of the dollar starts to increase as we pay down our ridiculous debts.
If this were the case the NIH curve segment costs would be (dividing by 1.87):
The first segment goes from birth to age 37 and has a slope of $1,307/yr.
The second segment goes from age 37 to age 56 and has a slope of $2,896/yr.
The third segment goes from age 56 to death and has a slope of $5,732/yr.
By doing so, health care becomes affordable to everyone and the path to self-sufficiency and free markets is reopened. The cost from age 20 to retirement becomes $131,000.
20-Year Plan Revisited
As a memory refresher, the key points of the plan after cutting discretionary government spending to 10% of GDP are:
However, the 8-9% of GDP costs are just what we'd pay if medical costs tracked the general cost of living (15.8%/1.87 = 8.33%), effectively putting the lie to the purported advantage of single-payer systems.
This is not a matter of demand outstripping supply; the supply of doctors has outpaced population growth for decades as shown below.
I had thought that the Department of Health and Human Services, our regulator in this area, was watching this but clearly (and unsurprisingly) it is not doing it's job. It does better on Medicare costs but the overall performance is generally miserable.
We may be shocked at the $60 billion price tag for cleaning up after Hurricane Sandy. We spent almost that much last week on health care. We spend more every year on artificial knees and hips than what Hollywood collects at the box office. We spend two or three times that much on durable medical devices like canes and wheelchairs, in part because a heavily lobbied Congress forces Medicare to pay 25% to 75% more for this equipment than it would cost at Walmart.
This is another indication that government is too big; it sucks at virtually everything it tries to do. Better to have four well run departments (Justice, State, Defense & Treasury) than 21 crappy ones.
How Do We Fix This?
In a well researched report, I learned that Japan regulates prices very aggressively so that spending there has increased by only 2 GDP percentage points in three decades as compared to 8 points in the US.
Ordinarily I'd oppose government price regulation in a free market but this is not a free market; government directly pays for more than 1/3 of all US health care (55 million in Medicare and 62 million in Medicaid) and subsidizes millions more with Obamacare. I was even able to convince my old pal Leo that this would not be an attack on free-market capitalism; an argument not easily won.
We have to cut prices nearly in half (1.87) to realign them with the ordinary cost of living by the time 20 years has gone by (reduce costs by 3.1%/yr for 20 years).
In a trend similar to what we’ve seen in colleges and universities — where there has been an arms race of sorts to use rising tuition to construct buildings and add courses of study — the hospitals improve and expand facilities (despite the fact that the U.S. has more hospital beds than it can fill), buy more equipment, hire more people, offer more services, buy rival hospitals and then raise executive salaries because their operations have gotten so much larger. They keep the upward spiral going by marketing for more patients, raising prices and pushing harder to collect bill payments. Only with health care, the upward spiral is easier to sustain. Health care is seen as even more of a necessity than higher education. And unlike in higher education, in health care there is little price transparency — and far less competition in any given locale even if there were transparency. Besides, a hospital is typically one of the community’s larger employers if not the largest, so few complain...except the likes of me.
Education has to behave reasonably right away; this farce has continued far too long.
If this were the case the NIH curve segment costs would be (dividing by 1.87):
By doing so, health care becomes affordable to everyone and the path to self-sufficiency and free markets is reopened. The cost from age 20 to retirement becomes $131,000.
20-Year Plan Revisited
As a memory refresher, the key points of the plan after cutting discretionary government spending to 10% of GDP are:
- Stop deficit spending.
- Pay all government debt.
- Federal debt is ~$14.5 trillion not counting Social Security.
- State debts are $1.2 trillion.
- Local debts are $1.8 trillion.
- Pay it with $750 billion/yr for 20 years plus the $4.5 trillion on the Federal Reserve balance sheet.
- Eliminate Welfare, Medicaid and Obamacare.
- Pay Social Security and Medicare for 20 more years while:
- Paying $15,000/yr to bottom 20% of earners,
- Paying $3,140/yr to all earners between ages 20 and 65.
- After 20 years, eliminate:
- Property, fuel, sales and sin taxes.
- All tax breaks, deductions, credits.
- All government-backed insurance.
- Institute a flat tax of 10.05% on earnings except the retirement accounts (akin to Roth IRAs).
| GDP | Federal | State | Local | ||
| $16,244,000,000,000.00 | $250,000,000,000.00 | $1,200,000,000.00 | |||
| Justice | 0.18 | 0.03 | 0.00 | ||
| State & Intelligence | 0.62 | 0.02 | 0.00 | ||
| Defense | 2.46 | 0.02 | 0.63 | ||
| Treasury | 0.10 | 0.28 | 2.50 | ||
| Transportation | |||||
| Roads | 0.00 | 0.03 | 0.24 | ||
| Rail | 0.00 | 0.00 | 0.00 | ||
| Sea | 0.00 | 0.00 | 0.00 | ||
| Air | 0.00 | 0.00 | 0.00 | ||
| Bus | 0.00 | 0.00 | 0.00 | ||
| Education | 0.00 | 0.20 | 2.74 | ||
| Percent of GDP | 3.36 | 0.59 | 6.11 | 10.05% | |
| Total | $545,200,000,000.00 | $1,464,750,000.00 | $73,276,800.00 |
Transportation (except for state & local roads) is funded by ton-mile fees on trucks, buses, trains, ships and aircraft.
The Cleanup Numbers:
| 2013 | ||||
| GDP | 1.62E+13 | |||
| Federal Revenue | 2.89E+12 | |||
| State Revenue | 1.63E+12 | State Deficits | ||
| Local Revenue | 1.12E+12 | Local Deficits | ||
| Spending Pool | 5.64E+12 | True GDP | 1.54E+13 | |
| Cleanup Fund | 4.10E+12 | |||
| Debt | 7.50E+11 | |||
| Social Securiity | 1.51E+12 | |||
| Medicare | 7.15E+11 | |||
| Poor | 7.50E+11 | 1.50E+04 | per person | |
| Seed | 3.77E+11 | 3.14E+03 | per person |
If we are able to dial back health costs so that they follow the CPI, this is what happens with my 20-Year Plan to those at the bottom, those in the middle and every other citizen.
- Children in poverty.
- The 20-year-old lifetime minimum wage earner.
- The 45-year-old lifetime minimum wage earner.
- The 45-year-old lifetime 21st percentile earner.
- The 20-year-old median wage earner.
- The 45-year-old median wage earner.
- Those between 45 and 60 years old.
- Public Employees.
- Private pensions.
- The 20-year-old lifetime minimum wage earner (in 2034).
- The 20-year-old lifetime median wage earner (in 2034).
Children in Poverty
These kids can use their $15,000/yr to pay for school choice.
Even in overpriced Connecticut, private elementary school tuition averages $9,201/yr and private High School tuition averages $28,618. This would cost $197,281 ($15,175/yr average) out of the $300,000 awarded to poor kids over 20 years. The rest (just over $100,000) could seed their retirements; parents can't touch it.
Please note that this is a lot less than public school in Shelton Connecticut at $19,098/yr ($248,275 over 13 years of K-12); government only reports the $63,700,000/5,137 students = $12,400/yr to hide the politically charged overhead costs.
| People | 39,400 | 3,500,000 | 311,000,000 |
| Teachers | 383 | 46,000 | |
| Students | 5,137 | 530,132 | 77,000,000 |
| Shelton Schools | |||
| Board of Ed | $1,088,000.00 | ||
| Schools | $63,700,000.00 | ||
| School Debt Service | $9,030,000.00 | ||
| State Education Dept | $40,525.71 | ||
| Retirement Board | $9,275.89 | ||
| Teacher Pensions | $8,917,239.13 | ||
| Teacher Retirement Health | $698,558.70 | ||
| State School Construction Bonds | $5,628,571.43 | ||
| Federal | $8,994,855.31 | ||
| Total | $98,107,026.16 | ||
| Per Student | $19,098.12 |
If I include the cost of what's called Educational Cost Sharing (redistribution), the per-student cost to taxpayers in my city balloons to more than $27,000/year!
This has to change now!
The 20-year-old Lifetime Minimum Wage Earner
Starting now, their 15.3% FICA would go to a private account (CD's yield 2.25%). They could save $5,000/yr of their $15,000/yr and buy insurance and whatever with the rest. They will also save the $3,140/yr seed/bonus money. In 20 years, they can start saving property, sales, sin and fuel taxes to accumulate $666,000 by age 65.

After retirement, they continue saving property, sales, sin and fuel taxes to augment their spending power. If their expenses are kept to what Social Security would have paid ($916/month) plus health costs ($5,732/yr), they could leave $692,000 to their heirs. This is how to fix poverty. Goodbye Medicaid, Social Security, Medicare and Welfare for them.
The 45-year-old Lifetime Minimum Wage Earner
As with the 20-year old group, their 15.3% FICA would go to a private account (CD's yield 2.25%). They could also save $5,000/yr (on graph below) or more of their $15,000/yr and buy insurance and whatever with the rest. They will also save the $3,140/yr seed/bonus money. They accumulate $277,000 by age 65.

After retirement (in 20 years), they start saving property, sales, sin and fuel taxes to augment their spending power. If their expenses are kept to what Social Security would have paid ($916/month) plus health costs ($5,732/yr), they could leave $148,000 to their heirs. Not as good as a 20-year-old but infinitely more than the big, fat zero they'll leave under the current system. Goodbye Medicaid, Social Security, Medicare and Welfare for them too.
The 45-year-old Lifetime 21st Percentile Earner
As with the 20-year old group, their 15.3% FICA would go to a private account (CD's yield 2.25% but this group needs a totally doable 3.5% to make it). They will just miss the $15,000/yr handout because their $17,000/yr income is too high.
They will, however, save the $3,140/yr seed/bonus money. They accumulate $184,000 by age 65 but they have to fund health insurance until then by other means (take another job?) as they do now; they can't afford Obamacare and they don't qualify for Medicaid.
They will, however, save the $3,140/yr seed/bonus money. They accumulate $184,000 by age 65 but they have to fund health insurance until then by other means (take another job?) as they do now; they can't afford Obamacare and they don't qualify for Medicaid.

After retirement (in 20 years), they start saving property, sales, sin and fuel taxes to augment their spending power. If their expenses are kept to what Social Security would have paid ($1,000/month) plus health costs ($5,732/yr), they could leave $7,000 to their heirs. Not as good as a 20-year-old but infinitely more than the big, fat zero they'll leave under the current system. Goodbye Medicaid, Social Security, Medicare and Welfare for them too.
Starting now as their income ramps in 25 years from minimum ($15,080/yr) to median ($42,000/yr), their 15.3% FICA would go to a private account (CD's yield 2.25%). They won't get $15,000/yr but they will also save the $3,140/yr seed/bonus money. In 20 years, they can start saving property, sales, sin and fuel taxes to accumulate $839,000 by age 65.

After retirement, they continue saving property, sales, sin and fuel taxes to augment their spending power. If their expenses are kept to what Social Security would have paid ($1,753/month) plus health costs ($5,732/yr), they could leave $852,000 to their heirs. Goodbye Obamacare subsidies, Social Security and Medicare for them.
The 45-Year-Old Median Wage Earner
This group starts at the median wage of $42,000/yr. As with the 20-year old group, their 15.3% FICA would go to a private account (CD's yield 2.25%). They also won't get $15,000/yr but will save the $3,140/yr seed/bonus money. They accumulate $253,000 by age 65.

After retirement (in 20 years), they start saving property, sales, sin and fuel taxes to augment their spending power. If their expenses are kept to what Social Security would have paid ($1,753/month) plus health costs ($5,732/yr), they could leave $148,000 to their heirs. Not as good as a 20-year-old but infinitely more than the big, fat zero they'll leave under the current system. Goodbye Obamacare subsidies, Social Security and Medicare for them too.
Those Between 45 and 60 Years Old
This group is tough because time works against them. However, there is room in my 20-year plan for them too. We still have six as-yet untapped revenue streams.
- Illegal immigrants are a big part of the poverty pool and, like under current programs, will not benefit under this one; membership has advantages.
- Poor toddlers will also not get $15,000/yr since they are not yet in school.
- Teen workers will also not get $3,140/yr since they should not be heads of households.
- We still have the $15,000/yr for the poor (20%) of this (45-60) group.
- We also still have the seed/bonus FICA for workforce participants (63%) in this group.
| Illegals $15,000/yr | $165,000,000,000.00 |
| Illegal Seed | $11,398,200,000.00 |
| Toddler $15,000/yr | $60,000,000,000.00 |
| Teen Seed | $15,700,000,000.00 |
| Old Poor | $192,199,227,000.00 |
| Old Seed | $134,782,911,254.20 |
| Total | $579,080,338,254.20 |

Public Employees
The state and local public employees are good because of the $3 trillion already saved. The pensions are considered under-funded for a 75-year forecast but this amount will easily last 40 years earning 7.6% (less than half of the fund's 2012 16% return) and paying out at current levels plus paying for federal employees with $508 billion left over; the federal government is well past broke so it can't pay without borrowing.
Contributions (7.65% of all payroll of employees older than 45, same as the rest of us) and outflows tail off after 20 years. Retirement health goes the same way. Those under 45 will do what everyone else does under this plan.

Private Pensions
First states (Illinois), then cities (Detroit) and now private pensions failing; need I say more? These government pension plans are galactically stupid.
Starting then, their 15.3% FICA would go to a private account (CD's yield 2.25%). No $15,000/yr. No $3,140/yr seed/bonus money. Instead, they can start saving property, sales, sin and fuel taxes immediately to accumulate $385,000 by age 65. The property, sales, fuel and sin tax savings fund insurance and the flat 10% income tax until retirement.

The 20-year-old Median Wage Earner in 2034
Starting then, their 15.3% FICA would go to a private account (CD's yield 2.25%). No $15,000/yr. No $3,140/yr seed/bonus money. Instead, they can start saving property, sales, sin and fuel taxes to accumulate $904,000 by age 65. The sales, fuel and sin tax savings fund insurance until retirement.

Summary
Senator Moynihan was more correct than he knew.
It is possible to move from the porous safety net we currently endure to one that works well for everyone with the worst case outcome being what happens now.
After 20 years, America will have restored itself;
- Debt-free or nearly so.
- Deficit-free.
- Budgets instantly balanced.
- Flat 10.05% tax (3.36% federal, 0.6% state and 6.1% local).
- GDP drops by 5-6 percent to reflect the end of deficit spending.
- Public pension problems end.
- Wealth generated even for low wage earners.
- CPI goes flat.
- Dollar increases in value (with no debt dragging it down).
- Consumer demand increases, driving job creation.
- Medical costs reined in.
- Public school costs reined in.
- Free long term care for those most in need.
- Medicare, Medicaid, Social Security, Welfare and Obamacare are long gone.
- Public schools in impoverished cities will have to compete like other businesses since poor kids will have $15,000/year at their disposal.
- Lifetime savings can be passed to heirs.
- People will have more of their gross pay in their pockets or retirement accounts.
- Charities will do much better with so much freed up cash.
From the law of unintended consequences, it turns out that wealthy people are being subsidized since subsidies depend only on the bottom line of form 1040.
I know someone quite well off who, despite best efforts to question the resulting $10,000/yr subsidy, got it anyway. This person had a policy cancelled so tried the exchange. The O-care policy would have been more expensive than what this person had but was 100% subsidized instead.
Makes me wonder how many of the 7.1 million enrolled folks are there on advice from shrewd accountants who read the law when Congress didn't.
In Memoriam
The world lost another good man.
My old friend Leo's Dad, Leo J. Clark Sr.
Rest in peace Mr. Clark.